
PhotoOmni Insights · 2026 report
2026 Passport Statistics & Photo Requirements
A curated collection of 2026 passport statistics covering applications, issuance, processing times, digital adoption, and passport photo requirements, based primarily on official government data and supplemented with PhotoOmni calculations.
PhotoOmni Data Sample: Submission Quality
This PhotoOmni data sample covers 30 anonymous photo pre-checks completed between 3 July and 17 August 2026. It shows where applicants in this sample most often needed help before their image was prepared for a document-photo specification.
| First automated pre-check result | Submissions | Share |
|---|---|---|
| Passed | 13 | 43.3% |
| Needs review | 16 | 53.3% |
| Unusable | 1 | 3.3% |
| Needs review or unusable | 17 | 56.7% |
The two most frequent issues were insufficient source-image dimensions and an out-of-focus face. Each appeared in 8 of 30 submissions (26.7%). A detected head tilt and an invalid face count each appeared once (3.3%).
| Photo-quality issue flagged during pre-check | Submissions | Share of all pre-checks |
|---|---|---|
| Source image dimensions below the required minimum | 8 | 26.7% |
| Face not sufficiently sharp | 8 | 26.7% |
| Head not level | 1 | 3.3% |
| No single usable face detected | 1 | 3.3% |
Top Stats
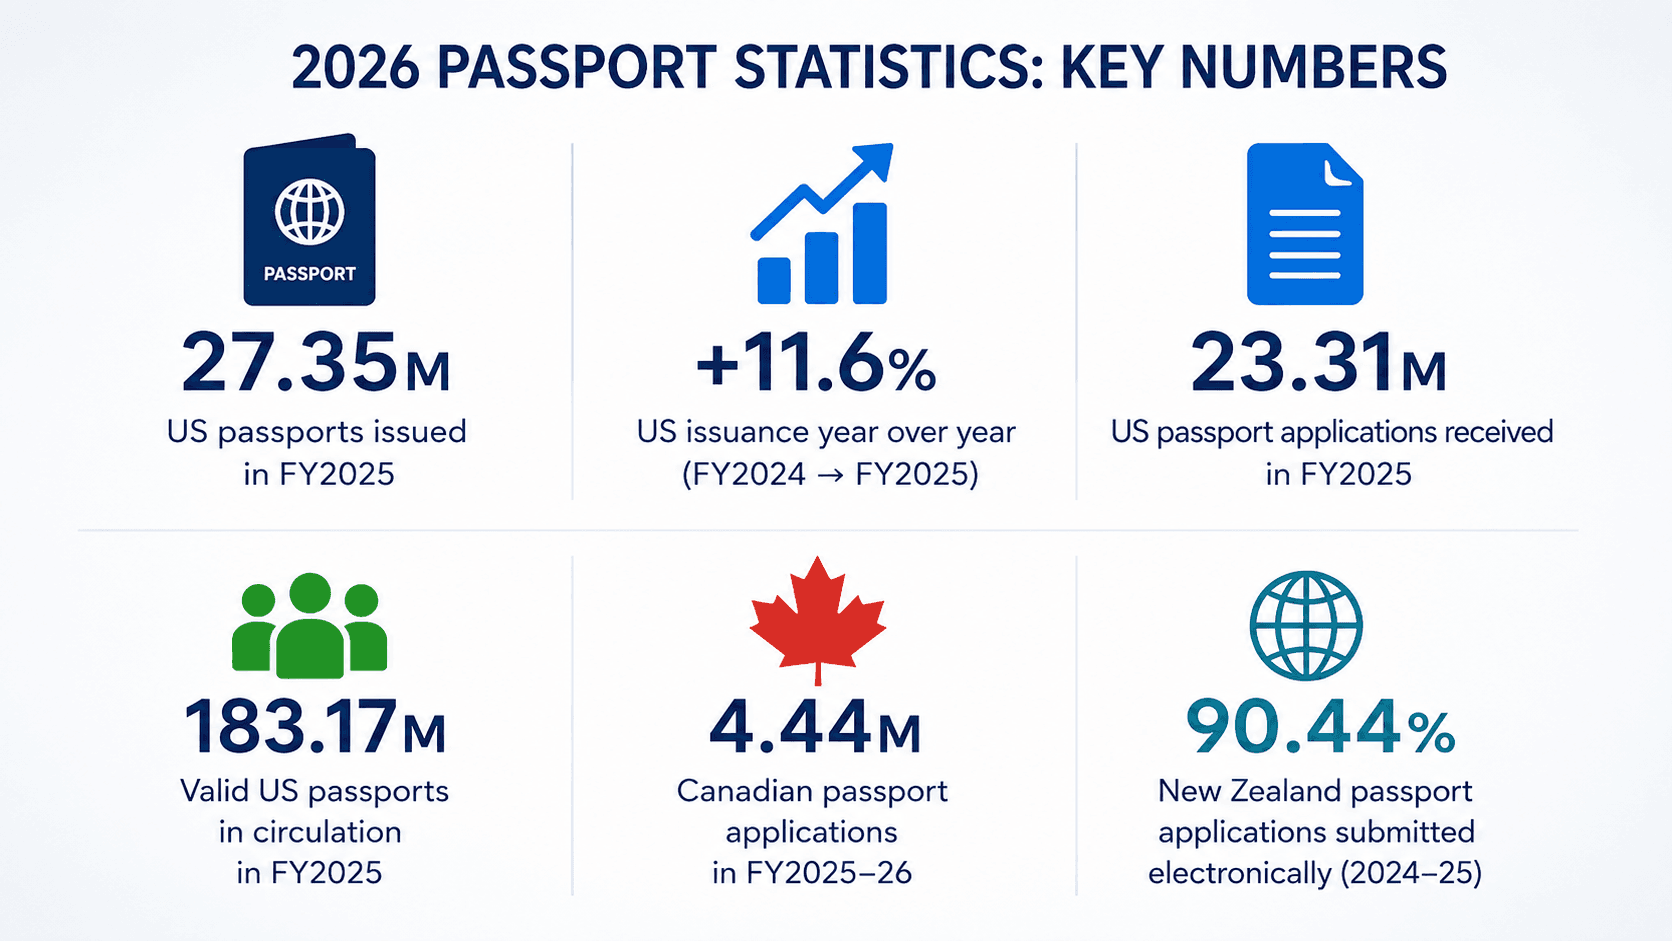
- The United States issued 27.35 million passports in FY2025 — the highest annual total in the State Department's published FY1996–FY2025 series.
- US passport issuance increased 11.6% year over year, from 24.52M in FY2024 to 27.35M in FY2025. PhotoOmni calculation based on State Department data.
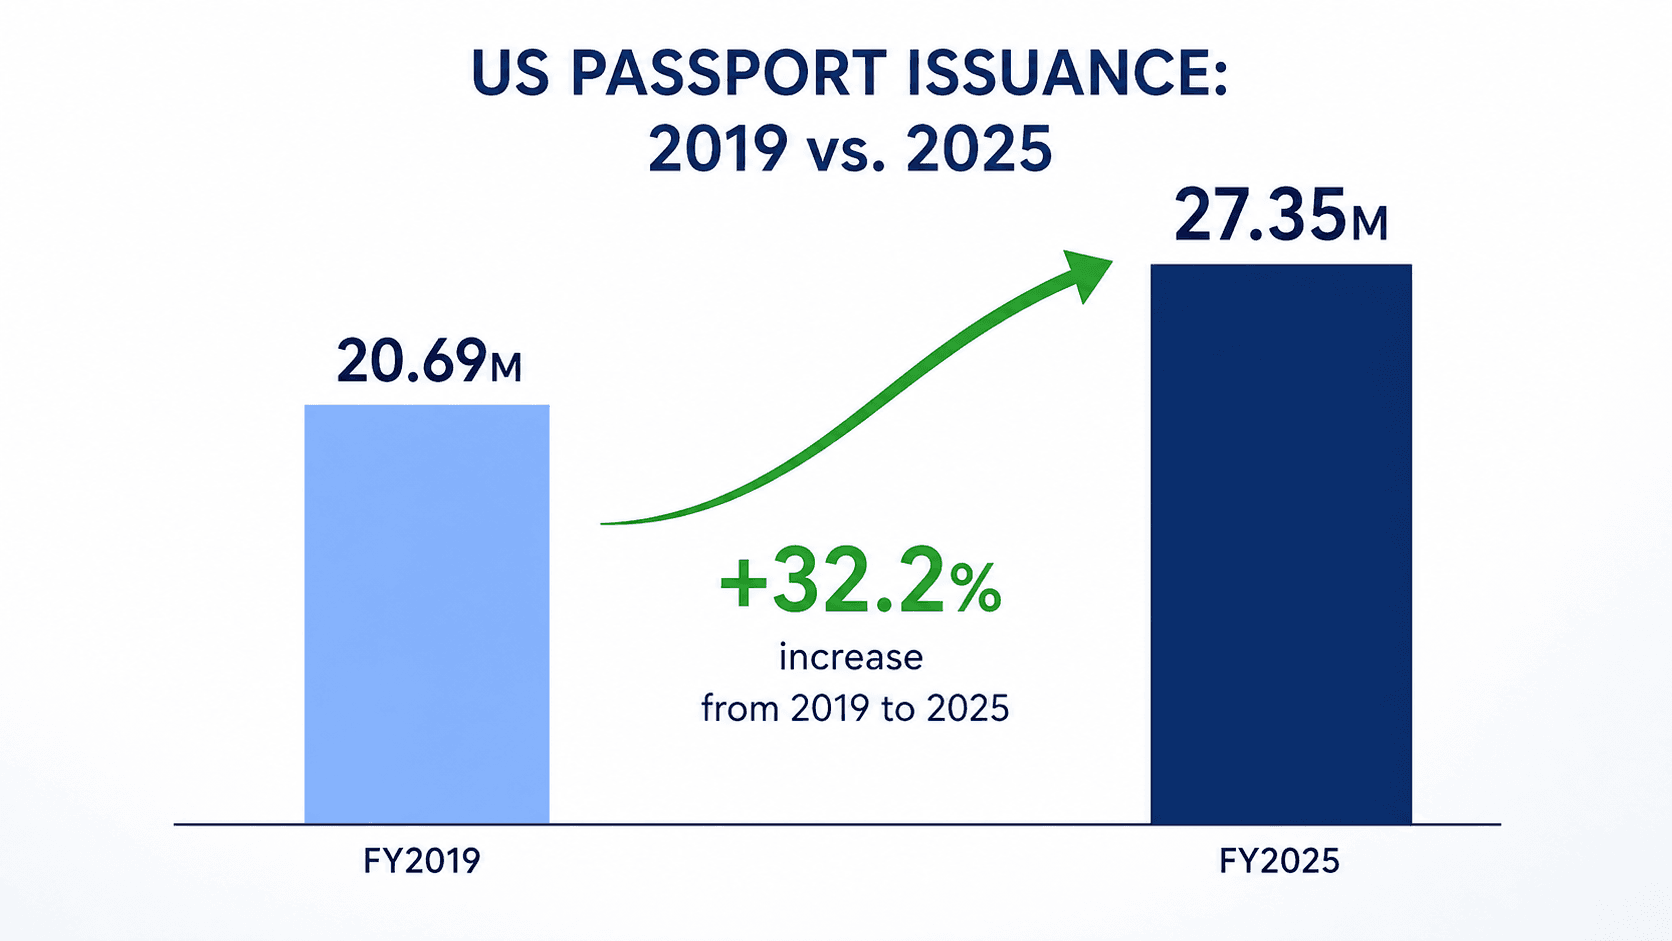
- US passport issuance was 32.2% higher than in FY2019, before the pandemic. PhotoOmni calculation.
- The US received 23.31 million passport applications in FY2025, up 14.1% from FY2024. PhotoOmni calculation.
- Approximately 74,900 US passports were issued per day in FY2025. PhotoOmni calculation.
- There were 183.17 million valid US passports in circulation in FY2025, up from 169.92M a year earlier.
- California recorded 3.12 million passport issuances, the highest total of any US state in FY2025.
- New Jersey passport issuance jumped 23.0% in a single year, one of the largest increases among US states. PhotoOmni calculation.
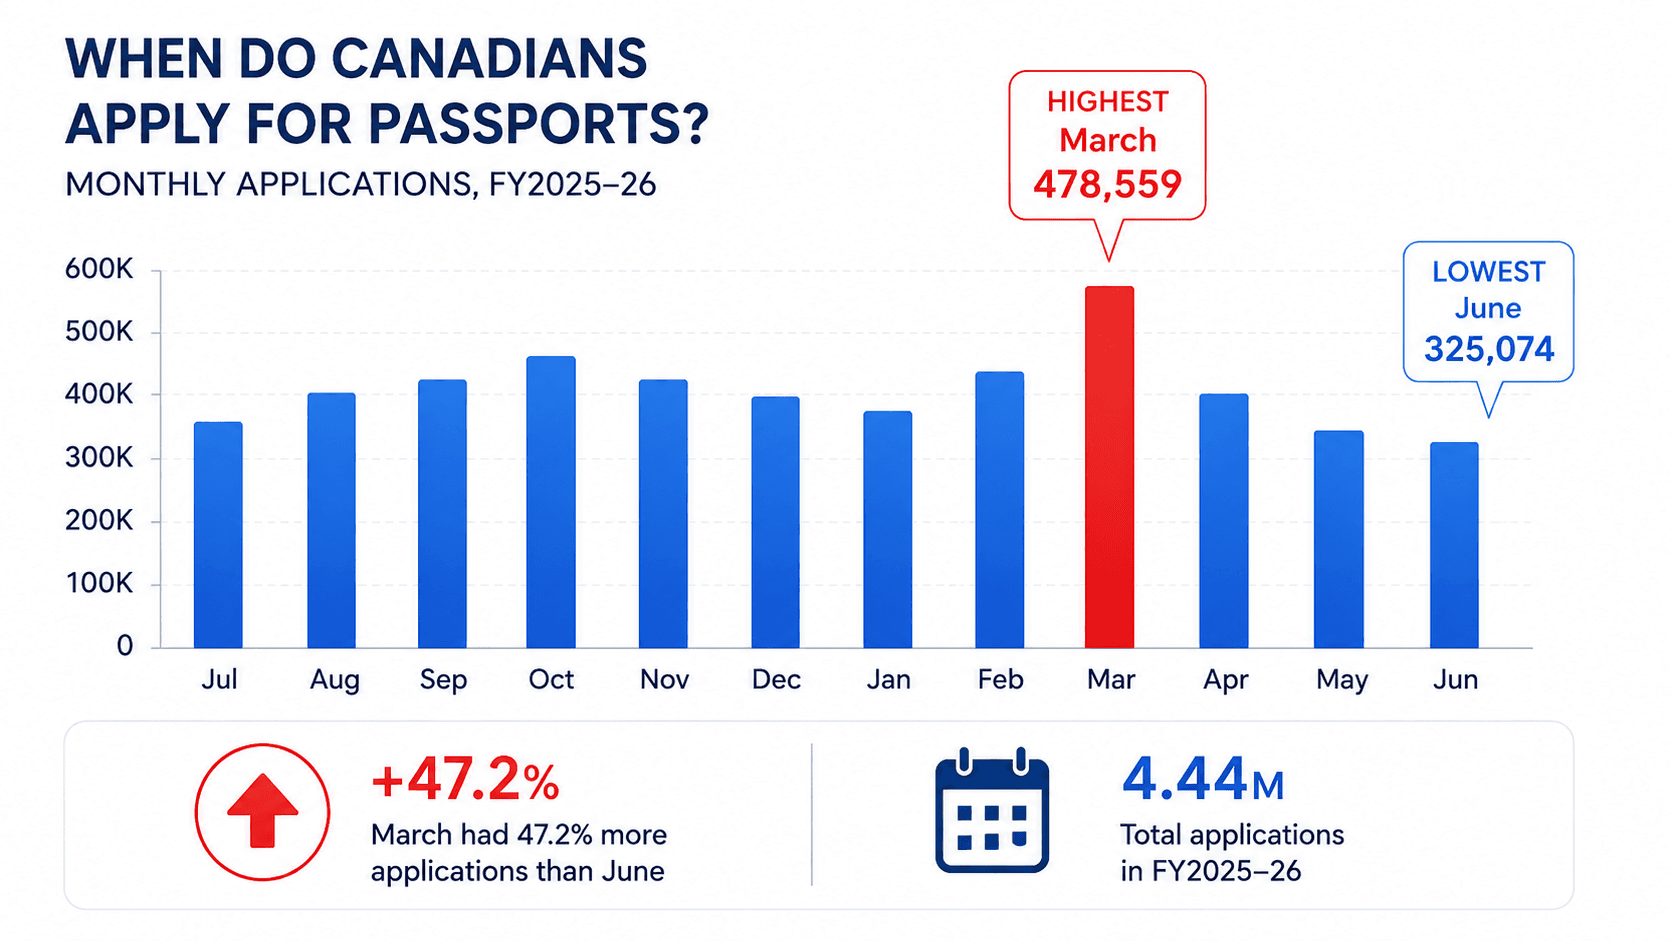
- Canada received 4.44 million passport applications during FY2025–26.
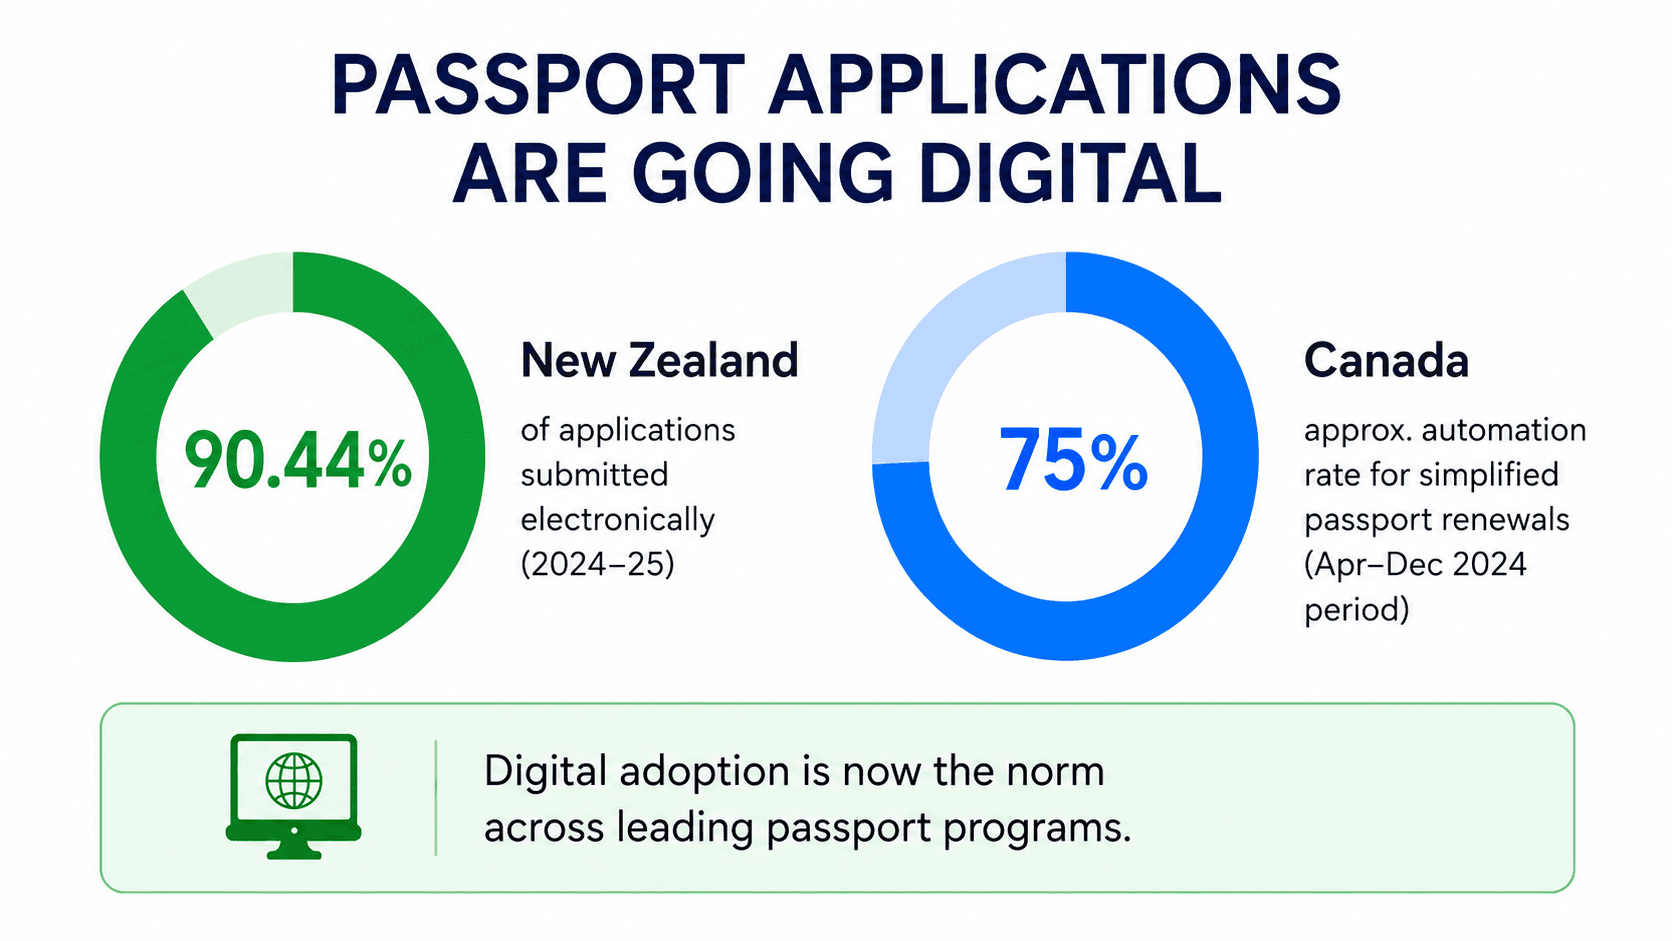
- 90.44% of New Zealand passport applications were submitted electronically in 2024–25.
- Australia processed 99.9% of Fast Track passport applications within five business days in 2024–25.
- More than 3.8 million UK passports were issued in the first six months of 2025.
US Passport Statistics
- The United States issued 27,348,416 passports in FY2025.
- Of those, 4,544,022 were passport cards.
- Passport cards represented approximately 16.6% of all US passport documents issued that year. PhotoOmni calculation.
- US passport issuance increased from 24.52M in FY2024 to 27.35M in FY2025.
- That represents an 11.6% year-over-year increase. PhotoOmni calculation.
- Compared with FY2019's 20.69M, FY2025 issuance was 32.2% higher. PhotoOmni calculation.
- Compared with FY2020's pandemic-era 11.71M, issuance has increased by approximately 133.5%. PhotoOmni calculation.
- Approximately 74,900 passport documents were issued per day during FY2025. PhotoOmni calculation.
- The US received 23,308,976 passport applications in FY2025.
- Applications increased from 20.44M in FY2024 to 23.31M in FY2025 — an increase of approximately 14.1%. PhotoOmni calculation.
- FY2025 applications were approximately 25.5% above FY2019 levels. PhotoOmni calculation.
- There were 183,170,240 valid US passports in circulation in FY2025.
- That was approximately 13.25 million more valid passports than a year earlier. PhotoOmni calculation.
- Valid US passports in circulation increased approximately 7.8% year over year. PhotoOmni calculation.
Important Data Note
The number of passports issued should not be divided by the number of applications to calculate an approval rate.
The State Department explains that one application can result in both a passport book and a passport card, and documents may also be issued in a different fiscal year from the year the application was received.
US Passport Statistics by State
- California: 3,120,262
- Texas: 1,962,631
- Florida: 1,613,834
- New York: 1,592,643
- New Jersey: 944,922
- Illinois: 869,928
- Pennsylvania: 806,982
- North Carolina: 682,057
- Georgia: 654,190
- Washington: 647,710
All figures are FY2025 passport issuances reported by the US Department of State.
California alone recorded approximately 1.59× as many passport issuances as Texas, the second-highest state. PhotoOmni calculation.
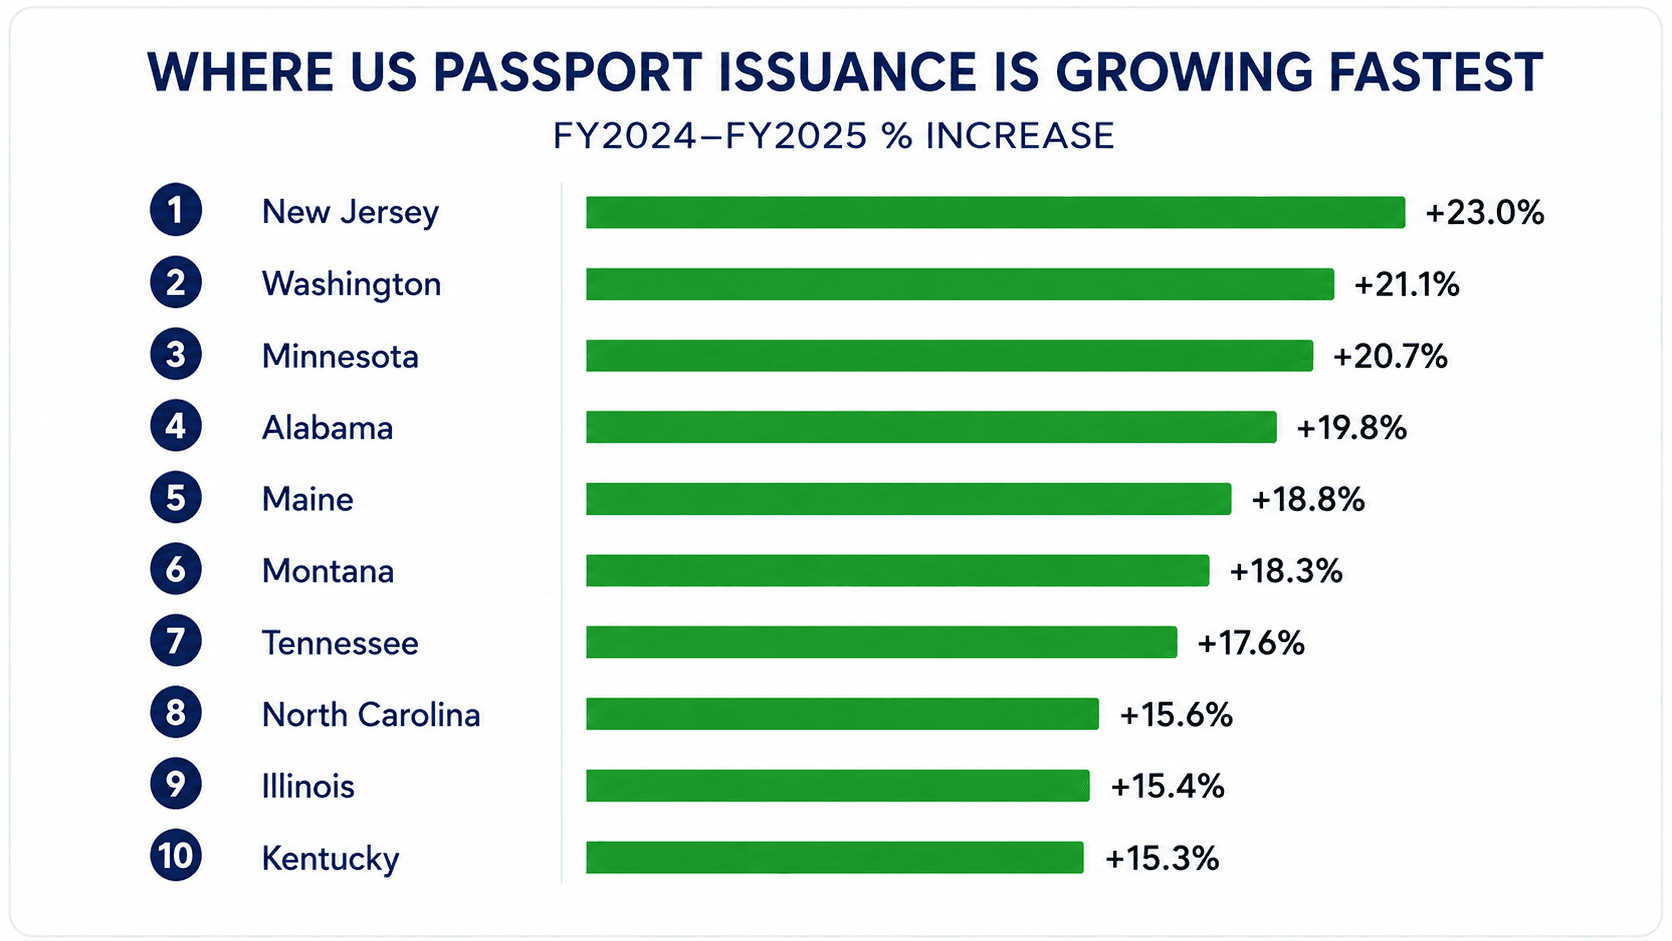
Where US Passport Issuance Is Growing Fastest
Based on PhotoOmni's comparison of FY2024 and FY2025 State Department data:
- New Jersey: +23.0%
- Washington: +21.1%
- Minnesota: +20.7%
- Alabama: +19.8%
- Maine: +18.8%
- Montana: +18.3%
- Tennessee: +17.6%
- North Carolina: +15.6%
- Illinois: +15.4%
- Kentucky: +15.3%
PhotoOmni calculations based on US Department of State FY2024 and FY2025 issuance figures.
New Jersey rose from 768,344 issuances in FY2024 to 944,922 in FY2025, an increase of more than 176,000 documents in one year.
Canada Passport Statistics
- Canada received 4,440,071 passport applications in FY2025–26.
- Canada issued 3,890,257 passports during the same fiscal year.
- March was the busiest month for applications, with 478,559 received.
- June recorded the fewest applications, at 325,074.
- Canada's busiest month therefore had approximately 47.2% more passport applications than its quietest month. PhotoOmni calculation.
- January was the second-busiest month, with 440,153 applications.
- February followed with 400,235 applications.
- Canada received 678,579 applications during April and May 2026, the first two months of FY2026–27.
- Canada issued 689,999 passports during those same two months.
- Around 75% of simplified renewal applications were being processed through Canada's automated passport-processing system during the period reported by Service Canada.
- That represented 1,712,777 automated renewal applications between April and December 2024.
- Approximately 93% of Canadians had access to passport services within 50 kilometres of where they lived, according to Service Canada's 2025 report.
UK Passport Statistics
- More than 3.8 million British passports were issued during the first six months of 2025.
- 99.7% of applications that did not require additional information were processed within three weeks.
- That performance exceeded HM Passport Office's 98.5% target.
- The current British passport design introduced in late 2025 was the first wholly new design since 2020.
Australia Passport Statistics
- 99.3% of travel documents were available within six weeks of lodgement in 2024–25.
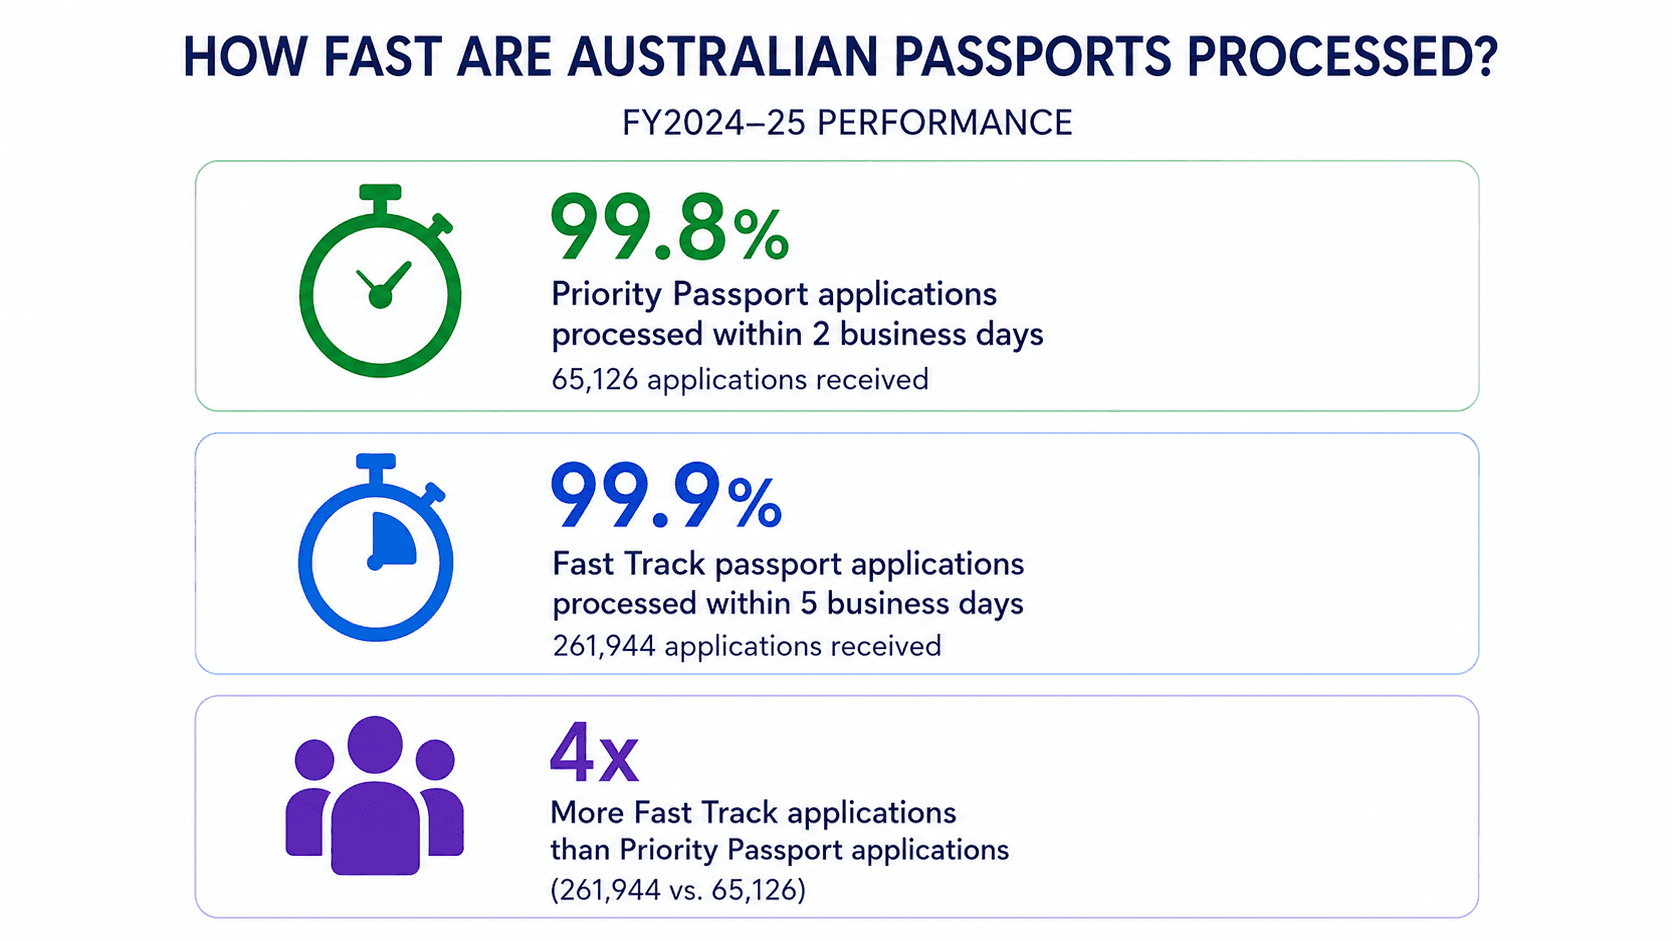
- 99.8% of Priority Passport applications were processed within two business days.
- Australia received 65,126 Priority Passport applications during the year.
- Only 131 Priority applications were processed outside the two-business-day timeframe.
- 99.9% of Fast Track passport applications were processed within five business days.
- Australia received 261,944 Fast Track applications.
- Only 195 Fast Track applications were processed outside the five-business-day timeframe.
- Fast Track recorded approximately 4× as many applications as Priority Passport service. PhotoOmni calculation.
New Zealand Passport Statistics
- New Zealand issued 410,122 passports in 2024–25.
- 90.44% of passport applications were submitted electronically.
- This means that more than 9 in 10 applications were submitted electronically.
The New Zealand data provides one of the clearest examples of how passport application workflows are shifting toward digital channels.
Document Reality: Passport Photo Size by Country
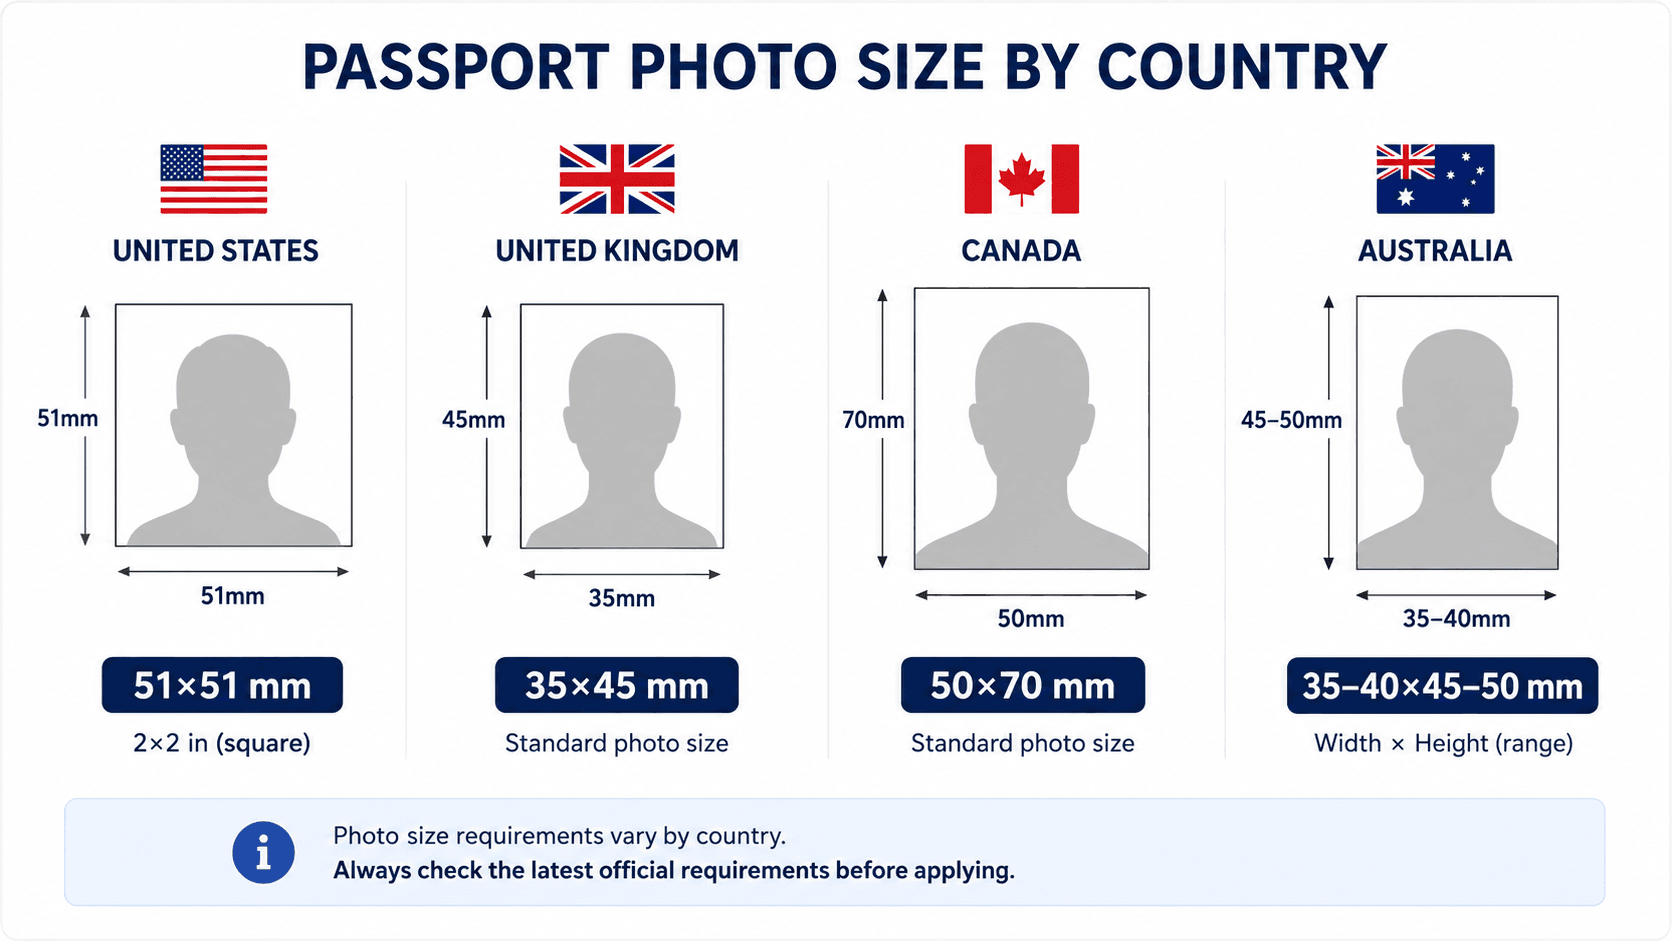
- United States: 2×2 in (51×51 mm).
- United Kingdom: 35×45 mm for printed passport photos.
- Canada: 50×70 mm.
- Australia: 35–40 mm wide × 45–50 mm high — a permitted range rather than one fixed dimension.
These differences mean that a photo prepared for one country's passport application should not automatically be assumed to meet another country's requirements.
Document Reality: Digital Photo Requirements
United States
- Printed passport photo: 51×51 mm (2×2 in).
- US visa digital images must use a square aspect ratio.
- Digital visa image dimensions: 600×600 to 1200×1200 pixels.
- Digital visa image file size: 240 KB or less.
- JPEG format is required for the State Department digital visa image specification.
The State Department also states that unacceptable photos are the number-one reason passport applications are placed on hold.
United Kingdom
- Digital passport photos must be at least 600 pixels wide × 750 pixels high.
- Files must be at least 50 KB and no more than 10 MB for the UK passport workflow.
- Digital passport photos must be in colour.
- The image must be unaltered by computer software.
Canada
- Printed photos must measure 50×70 mm.
- Face height must be 31–36 mm from chin to crown.
- Two identical, unaltered photos are required for the standard passport application covered by the current guidance.
- Canada states that altered photos — including photos changed using filters, editing software or AI tools — will be rejected.
Australia
- Photo width: 35–40 mm.
- Photo height: 45–50 mm.
- Face height: 32–36 mm.
- Photos must have a plain white or light background.
- Retouching is not permitted.
Passport Photo Requirements Are Not Universal
The numbers show a surprisingly fragmented system.
A standard US passport photo is 51×51 mm, while a UK printed passport photo is 35×45 mm and a Canadian passport photo is 50×70 mm. Australia does not prescribe one exact width and height, instead accepting a 35–40 × 45–50 mm range.
Digital workflows introduce another layer of requirements.
For example, UK digital passport photos must be at least 600×750 pixels, while the US State Department's digital visa image specification requires a square 600×600 to 1200×1200-pixel image.
Known Data Limitations
- Fiscal years are not identical across countries. US FY2025, Canadian FY2025–26, and Australia/New Zealand 2024–25 should not be treated as the same reporting period.
- Passport applications and passports issued are different metrics. In the US, one application may result in both a passport book and a passport card.
- “Valid passports in circulation” does not equal the number of individual passport holders. The State Department notes that some people hold both a passport book and card, or more than one valid passport book.
- Australian “travel documents” include more than ordinary passports. DFAT's six-week performance statistic includes passports as well as certificates of identity, convention travel documents and documents of identity.
- Photo rules vary by application channel. Printed passport, online passport, visa and immigration-photo specifications should not be treated as interchangeable.
- Government passport statistics may be revised after publication. Canada, for example, explicitly notes that some statistics may be updated retroactively as reporting systems are refined.
Methodology
PhotoOmni reviewed publicly available passport statistics and photo guidance from government sources, including the US Department of State, Government of Canada, HM Passport Office, Australian Department of Foreign Affairs and Trade, and New Zealand Department of Internal Affairs.
Where this report shows percentages, growth rates, daily averages, ratios or comparisons labelled PhotoOmni calculation or PhotoOmni analysis, the figures were calculated from the underlying government data rather than published directly by the source.
This report does not calculate passport approval or rejection rates from application and issuance totals because the underlying datasets are not designed for that comparison.
Passport and photo requirements can change. Applicants should verify the current requirements published by the relevant government authority before submitting an application.
Primary Sources
- US Department of State — Reports and Statistics
- US Department of State — Passport Photo Requirements
- US Department of State — Digital Image Requirements
- Government of Canada — Passport Program Statistics
- Government of Canada — Passport Photo Requirements
- Service Canada — State of Service 2025
- HM Passport Office / GOV.UK — Passport Statistics and Photo Guidance
- Australian Department of Foreign Affairs and Trade — Annual Report 2024–25
- Australian Passport Office — Passport Photo Guidelines
- New Zealand Department of Internal Affairs — Annual Report 2024–25